Wednesday, December 24, 2008

Market Rally Up From Morning Low

The market seems to be rallying up from the morning low. I wasn't looking at the intra-day movement and sold off my NOL holdings at S$1.14 (bought at S$1.04). Since I am not a day trader (I am a Weekend Trader, remember?), I paid no heed to intra-day movements.

This counter showed weaknesses by having double down bars with second closing below the first. It is also scheduled to meet the 20MA. The 20MA is expected to provide some support. However, as I do not have good data for the WOOTH charting method, I decided to play it safe and took the depleted profit of $0.10 missing out the major part of $0.25. Since the major trend is still down, it has higher potential to turn down than up. Defensive play is the key now.

Both MACD and Stochastics are showing signs of down trend which also coincides with the price trend in the short term. I think I will wait and see how it perform over the next few trading sessions.

Tuesday, December 23, 2008

SGX Market is heading for correction again!

It seems that SGX Market is heading for correction again after some weak showing over the last 2 sessions. The major news is that DBS is raising fund again. This time, a total of S$4 billion. This is huge number by Singapore standard. It is equivalent to about S$900 per resident or S$2,700 per working adult assuming 1 in 3 in the population is working. In a weak market like this, a rush to raise capital is something worrying to me. I think the share price will move lower to even below $9 prior to adjustment or below $8 after adjustment. This is just based on gut feeling. No concrete calculation is done.

Note: Sold Capitaland at $3.18 yesterday in the early afternoon after looking at the market during the lunch hour. Took profit of $0.62 per share (24%). Based on my WOOTH, the good and safe entry price should be $2.40. However, this counter is strongly supported and the largest counter in property sector (as in SingTel), it commands some additional premium (I guess). You see very strong support at S$2.50 ~ S$2.60 level. So, entering around that level is quite safe.

Missed out NOL when it was $1.28~$1.32. Was not able to sell due to work commitment and not watching closely enough. Seems like Weekend Trading method is not easy. However, still holding on to the paper gain of S$0.12 per share instead of S$0.30 per share. I hesitated earlier and it when down, boom, boom, boom.

Current holdings:

STOCK NAME AVE COST PRICE LAST DONE PRICE +/- +/-%
COMFORTDELGRO 1.49 1.38 -0.11 -7.38
NOL LTD 1.04 1.16 0.12 11.54
SING TEL 2.3 2.55 0.25 10.87
ST ENGG 3.18 2.29 -0.89 -27.9

NOTE: I had to batches of SingTel. First batch was bought at 3.67 and second at 2.30 with equal volume. I sold half at 2.48. The system uses FIFO, so it assume I sold off the first batch and took a loss of 1.19 (heavy losses). Actually, I meant to treat the 2.30 batch as short term trade.

Sunday, December 21, 2008

Stock Analysis using WOOTH method

ST Engg:
ST Engineering used to be called the defensive stock. However, under this down turn, it is not spared. Looking at the history more closely, one can realize that it did badly during the previous recession. The so called defensive by analyst is totally unfit.


SingTel:
SingTel is another defensive stock by analysts. Again, looking more closely at the past recession, it becomes obvious that this stock is highly correlated to overall economic cycle. It is not defensive as it is perceived by analysts.

Thursday, December 18, 2008

SGX - Stock Market Direction - short term bullish

Sold DBS just now for 9.64 'cos I think the chart seems to turn bearish (bought at 9.08). Took profit. I think it may go below 9.30.
Hold ComfortDelgro (bought at 1.49) chart seems to turn bullish. Higher lows and higher highs. Above 20MA & 50MA.
Hold Capitaland (bought at 2.56 ave) chart seems still bullish. Above 20MA & 50MA.
Hold NOL (b 1.04). Bullish. Above 20MA & 50MA. 50MA seems to be strong resistance. Just above 50MA. See if it holds.
Hold ST Engg. (b 3.175). Lower highs. Above 20MA & 50MA. Entered too early.
Hold SingTel (b 3.67). Higher highs & higher lows. Above 20MA & 50MA. Bullish in near term.

Sunday, December 14, 2008

STI Chart Pattern - Market Review

The Market is turning bullish for short term now. Looking at the STI chart, you can see that it has bounced off the support for the second time and it stays above 20 Day MA. Apart from that, the 5Day MA is also above the 20 Day MA. That shows that short term, the market is still bullish even though there has been some corrections. There has been some strong buying early last week before the bad news set in especially the failure to reach agreement on bailout package for auto industry in US.


Wednesday, November 26, 2008

Time Horizon Windows of Opportunity - Different Ways of Looking at the Prices

I am coming up with a scheme to measure based on time line, how the prices of each stock fare. I call this Windows of Opportunity using Time Horizon.

Why am I making such comparisons? The fact is that I had been trying to catch the bottom during this down trend. But, I'd found it too difficult and each time I tried, I would get burnt. So, to overcome that, I come up with this scheme. I started by looking at each stock's historical prices and using time horizon to measure the prices. This allows me to measure how much "time opportunity" that I have to trade (buy or sell) certain stock at certain prices assuming historical price is a good reflection of the future events.

I would buy the stock if it goes below the 90% time line mark. Not 90% chance or 90% of the price. I am not using price or probability (if there is a way?), I am using time line. If you are getting stock which is 90% low for a good company, I believe you will gain holding that stock and it would be a good price to enter.

DBS Bank:
Based on the 10 Year price charts, the following observations were made:
About 90% over the last 10 years, the prices of the stock has stayed above S$9.50. Which means that you have opportunity to buy the share below S$9.50 only 10% of the time.


My entry point for DBS is below $9.50 and holding for long term (> 3 years). Even it the share goes to the 1998 lows, I believe it would stay there for a short period of time only. Since I am not a day trader, it is unlikely that I would be in front of the screen to catch it.

Note: Bought DBS @ $9.08.


Capitaland:
I only have information up to 2001. Based on these 7 year data, I concluded that a reasonable "buyable" price should be below S$2.40 and good and very safe entry point should be below S$1.50 (see below).


Even though the prices has corrected quite a lot, its lack of historical background is making it look more expensive that it should. So, anything below $2.00 could be a good entry point. However, if you were to stick to the principle of margin of safety, then, below $1.50 is certainly the way to go.

Bought Capitaland @$2.56. Support seems strong.


CityDev:
This stock presents much better entry situation than Capitaland in terms of Property Sector. It is near the entry level of S$5.00 now. Historically, 90% of the last 10 year's prices are above S$5.00. Rallying to $7.00 should be no problem.
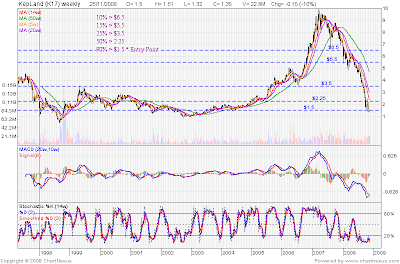


Keppel Corporation:
I had been monitoring this counter quite closely. Adjusted for the split, good entry price should be about S$3.00. With the uncertainty in the current market, it is entirely possible for it to go below S$3.00. But anything below S$4.00 would make good investing opportunity for this counter with its strong dividends.


Keppel Land:
This is a stock that I had not been monitoring so closely. However, based on the recent performance, it tracked quite closely with CapitaLand. This counter reacts more severely to the current sub-prime crisis that Capitaland. I believe it was due to its nature of investment and it is heavily in the residential sector which is perceived to be under severe duress. The current price of S$1.37 is 10% below the S$1.50. This counter presents a good entry opportunity. We need to look at is balance sheet and profit and loss statement and the nature of properties it is holding to be double sure of the risk involved.


Cosco:
This is one time the darling of investors having pushed the price from around $1.35 to $8.0 within a period of 15 months from July 2006 to October 2008. An amazing counter int he SGX. This is the big brother of all S-Shares (China companies listed in SGX) in terms of market capitalization. Even though the prices has been badly battered down to the tune of over 90%, the Windows of Opportunity is not as clear as the counters presented above due to it short history and the fly-by-night nature. The lack of transparency is also another concern.
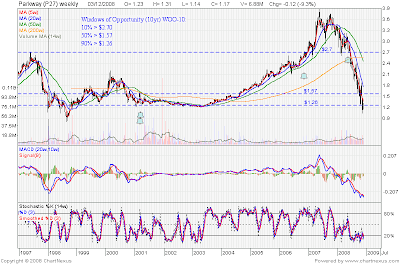


Parkway Healthcare Group:
Parkway is now below the 90% WOO level.


NOL:
The ChartNexus chart for NOL is skewed due to adjustments to dividends which as not done correctly. Similarly for all the other charts, the programming was not done properly when comes to adjustment to dividend. I think they just adjust according to the amount of dividend given instead of taking a ratio. That resulted in negative prices for past records. Anyway, NOL is now below 90% WOO based on 6 year chart. No 10 year data available.

Current prices of $1.20 presents a good entry point for long term.
Note: Bought NOL at $1.04.

Tuesday, October 14, 2008

Market heading for a strong rally

With the positive news that the developed nations are acting together to avoid the major financial melt down, the global stock market is heading for a strong rally. The STI is showing strength in the surge yesterday.


This is probably the strongest one-day rally we had ever seen. Today, it maybe more buying as US and European markets all showed strength last night. Expected to rally for a period of 4-6 weeks before seeing next wave down. There will be a mad rush to buy this week. That may push the index up by another 200 points before investors start thinking again.

Friday, October 3, 2008

Singapore Stock Market Trend: Not bottom yet

In line with the Dow Jones and S&P500, the STI is showing no signs of bottoming. Looking at the various levels of support and resistance, we can only conclude that there is more down side. So far, the volume does not show any sign of panic selling, unlike 1998 or 2001 or even March 2008. The current down trend seems to be slow and steady. In that sense, we will have to wait for the slow turn around as well. We should not expect quick bottoming even if the US$700 bail out plan (or buy out plan as some would like to call it) is approved.

Here is the STI chart.


There seems to be some divergence from the indicators which may signal some short term rebounce. Nothing is indicative of any sustainable rally coming (talking about sustainable for a for over 3 months). The market can stay oversold for quite a while.

Wednesday, October 1, 2008

Jaya Holding - Not best time yet

This is a counter that has enjoyed super bull run for 5 years with price change from the region of $0.25 all the way to over $2.00. The gain of about 800% in 5 years. Those who had invested in between 2002 and 2003 and hold on until 2007 would have been rich.

Anyway, no point on the hind sight. What is important is that the trend is still down and not matured for accumulation yet. Too risky to go in now.

Keppel Corp - Not Ready to accumulate

Keppel Corp is continuing the down trend. One of the main reason is the overall industry outlook. The demand for oil rig construction is expected to shrink and some of its competitors are facing order cancellation. This certainly puts pressure on KepCorp price. Currently, it is trading in a down trend channel.


With the current uncertainty, the prices is expected trend down further. Even if there is a rescue package (which should be one), the price may bounce back and trend down again. Good position to accumulate would be somewhere around $6.00 to $7.00.

Sunday, September 28, 2008

Venture Technical Analysis - Down trend

Continued from 2 weeks ago, Venture bounces of the 20MA and resume its down trend. Overall market condition is still no good for consumer electronics. With the threat of recession, it may not see any near term turn around. However, the US bail out which should be passed soon, will provide some relief to the counter. It may break the 20MA and meet the 50MA. However, this will be short lived as longer term trend should still favors downward movement.


Snapshot of Venture Corp's chart as of 26th September 2008. There is indication of over sold and potential for some short term bounce. However, any trade into this should be short and quick.

Saturday, September 13, 2008

Price Trend - Venture Corp

I am expecting further down trend for Venture Corp. Firstly the electronics market seems to be heading for some kind of slow down. Nasdaq is also experiencing some strain recently. Secondly, from the technical analysis, it has bounce off 200MA and then 50MA and 20MA. The pattern seems to resemble what some people called "the kiss of death". But they are not exactly the kiss of death since it did have the kind of sudden surge in price and sudden fall within the same day.


Waiting to see if it will bounce off the 20MA again.

Thursday, September 11, 2008

Stock Market Major Trend is Still Down

Yesterday, Dow Jones and S&P gave up all their gains since the rescue of Freddie Mac and Fannie Mae due to the uncertainty facing Lehman Brothers. The market experience continuing selling pressure until near towards closing. This morning, STI followed and give away over 3.1% to close at 2541.  At the rate it is going, I won't be surprise if it hit below 2000.

Market is expecting more troubles to come and Merryll Lynch has been siad to be next in sight. With such market sentiment, it would be safer to stay at the side line for long term investors. This is a day-Traders'  environment. You need to be fast and nimble. No time for careful thinking if you are playing the market now.

Today, I am expecting US market to have some further selling.

Tuesday, September 9, 2008

STI Market Direction in near Term


After the rally from the rescue of Freddie Mac and Fannie Mae, can the market sustain the up trend or will it succumb to the general market down trend again?

Saturday, August 23, 2008

Stock Market Review - Has the market bottom out?

This is a billion dollar question!

If you are sure that the market has bottom, what would you do? Of course buy big time and wait for it to recover. What if it takes another 5 years to recover? Are you able to wait for so long? In the end of the day, investing is about ability to hold it out. If you are only looking at 3 months or 12 months time frame, then, it will be speculating on short economic cycles and a lot of risk is involved.

When the market is on a down trend, it tends to be extremely volatile. Price swing is much large than in the uptrend. You need to be able to take the fluctuation in good strike and be confident in your decisions.

According to Ben Graham, one must be able to take the down swing of up to 33% in order to be able to consider yourself an investor. If you are think of entering at the bottom of the market and trying to sell at the peak of the market, chances are that you will miss both by a lot.

Thursday, August 14, 2008

Oil Prices Forced Comfort Delgro Stock Price Down Further

As a follow up on ComfortDelgro, it experienced a major down turn after crude oil made record highs.

With the recent correction in crude oil prices, one would expect the share price to move up. But, it did not. It continue further down and side ways after reporting not too good results. One can expect that the oil price will remain volatile and the how much will it go down is anyone's guess.

Is the current price a good support level? It seems strong around $1.50-$1.55 level.

Saturday, July 12, 2008

ComfortDelgro - More downside to come?

I entered ComfortDelgro at 1.59 for 10,000 shares and exit at 1.78 and later saw it move above 1.85. Subsequently, I enter at 1.71 and exit at 1.82 for a small gain. It fell further and I went in again at 1.76 and and then 1.71 exit at 1.60. So, I gave back most of my gains. This is life!

Looking ahead, the short term chart of ComfortDelgro shows a clear down trend and the rebound is not yet convincing. With oil prices hovering at the high and the price trend of crude future remains very strong uptrend, there is not indication that this counter will be bottoming. At 1.47, the price looks quite attractive. My previous post commenting that the downside was limited became obsolete. I should have qualified the time frame. This is stock market. Time frame is very important.

Lesson learned.

The current rebound will be short lived with oil suddenly surge up last night. Let's wait to see if the oil price will come down and stabilize. Oil price will eventually come down but when? So, there is no point long on this counter now! Too much risk!

Monday, March 17, 2008

Stock Trading Commandments

Never Turn Trades into Investment

When the market move against you, cut loss. When the you get it right, take profit. Don't be greedy. You won't know when it will turn.

Your First Loss Is Your Best Loss

When you trade turn awry, cut loss fast. The subsequent loss is likely to be more severe.

It Is OK To Take Loss When You Already Have One

Losses, realized or unrealized, are actual losses. Unrealized losses if not taken, may lead to bigger losses.

Never Turn a Trade Gain Into Investment

Do not be too greedy. Know when to get out. Market can turn anytime.

Tips Are For Waiters

Don't be fooled by hot tips.

You Don't Have a Profit Until You Sell (Close the Trade)

Paper gains can be wiped out when market swings.

Control Losses: Winners Take Care of Themselves

It is more important to pay more attention to losing trade and limit the losses. You don't have to worry too much for the winners.

Don't Fear Missing Anything

The opportunities will come again. Don't chase the price.

Don't Trade Headlines

News headlines are too brief and inaccurate. They just want to get it out quick. Read into details. The stock will not fly away.

Don't Trade Flow

Don't buy just because someone is trying to sell you and you think it is convenient. Do research before you buy anything.


Saturday, March 15, 2008

Truth About Stock Price Movement and Fundamentals

Do you think you really own a piece of a company when you own its stocks? Personally, I do not think so. The stock exchange is way to disconnected from the company of the stock that is listed apart from requesting them to provide regular reporting. The prices of the stock is purely supply and demand. The market capitalization is not a real measure of the net worth of the company. It is a measure of the willingness of the market participant to pay to own the stocks at a certain point of time.

In the long term, say over 10 - 20 years, the stock prices will fluctuate resolved to the fundamentals. However, over the short term with 18 months, the price movement usually is not any reflection of the fundamentals. It is essentially a reflection of sentiment aka supply and demand.

Saturday, March 8, 2008

ComfortDelgro - downside risk limited

I went into this counter recently at average price of $1.595. I must admit that this is not the best price but after looking at the recent movement, I found this counter steady during the heavy sell downs. This is a dividend stock with yield of over 5%. The price of the counter is steady and limited fluctuation.

Has the market bottom out yet?

Many investors like to use the term "bottom fishing" to describe their action in bargain hunting for under valued stocks. In essence, what they are doing is to try to catch bottom. However, for many experienced traders, catching bottom is a dangerous action. Here is why:

Market bottom is a process, not an event.

Why you can't catch the bottom. For investors, your only choice is to buy stocks on the uptrend, not downtrend. Let other people find the bottom for you. Just sit back and watch them fight it out. Conserve your capital and avoid taking unnecessary risks.

Just look at the mistake I made on Chip Eng Seng. I thought when the price dropped from over $1.10 to $0.83, it was a good time to enter. In the end I had to cut loss at 0.59 (yet another mistake for not sticking to my rules of cutting loss at $0.75). During the market crash, the sell down can be fast and furious. If you are not in front of the screen, you will be caught dead. Yes, I was on a consulting project during the period and when I look at it, it was already hitting $0.60. So, the notion of buy-and-keep is not always the best approach. As you can see, this counter has gone down from peak of $1.10 to $0.49 (more than 50% off) and yet still bottom is not in sight.

Chip Eng Seng Update 2

Chip Eng Seng went on to close at 0.49 yesterday. In general construction counters continue to show weaknesses. This is due to a few reasons. One, the real estate market is cooling off faster than expected. Nothing new, I was caught off guard 10 years ago resulting over half million dollars loses.
Two, material costs is sky rocketing. Three, new projects are not coming. All the fads built into the prices has to reverse out. Fall out from US sub-prime saga.

I am expecting these counters to go down further in the mid term. With the overall market bear trend continuing, the bottom is not in sight yet. However, there might be some short re-bounce due to bargain hunting at highly oversold region. If it breaks 0.47, it should further test 0.42 and 0.30.

Wednesday, February 20, 2008

Chip Eng Seng - Update

Chip Eng Seng failed to break the resistance on 0.895 a few months earlier and resulted in failed rally. Failed rally tends to fail quickly and it quickly dropped to below 0.50 within 2-3 months aided (no thanks) by the overall market collapse. I failed to sell of at 0.87 and resulted in heavy loses. That was during a period when I was too busy with my consulting job and did not monitor the market for a few months.

I finally sold off at 0.59 to cut loss and I bought into ComfortDelgro at 1.595 on average for long term investment and dividend play. ComfortDelgro is trading near its 3-year low of about 1.40. I believe 1.40 will be a very strong support for ComfortDelgro. For long term dividend play, going in at 1.60 is still viable since the dividend is around 3-4% on average.

Chart Patterns 1 - Symmetrical Triangle

Symmetrical triangles tends to resolve to the primary trend.

Currently, DOW, NASDAQ & S&P are forming symmetrical triangle. Looking at the primary trend, it points to a general down trend for daily charts, weekly charts. So, we can generalize that the tendency is for market to move lower in the short term.

There has been a inverted head and shoulders patterns for the intra-day charts but they failed to form and these will lead to further break downs.

Similar pattern is spotted on the STI. Daily and weekly charts showing primary trend is moving down. So, it is expected that the short term rally will tend to fail and resolve back into down trend.

Google News - Business

Bloomberg

Yahoo! News: Business

Reuters: Top News

About Me

My photo
I'd like to share my experiences and knowledge about healthy and happy living as well as mid-life crisis. 不以物喜,不以己悲。