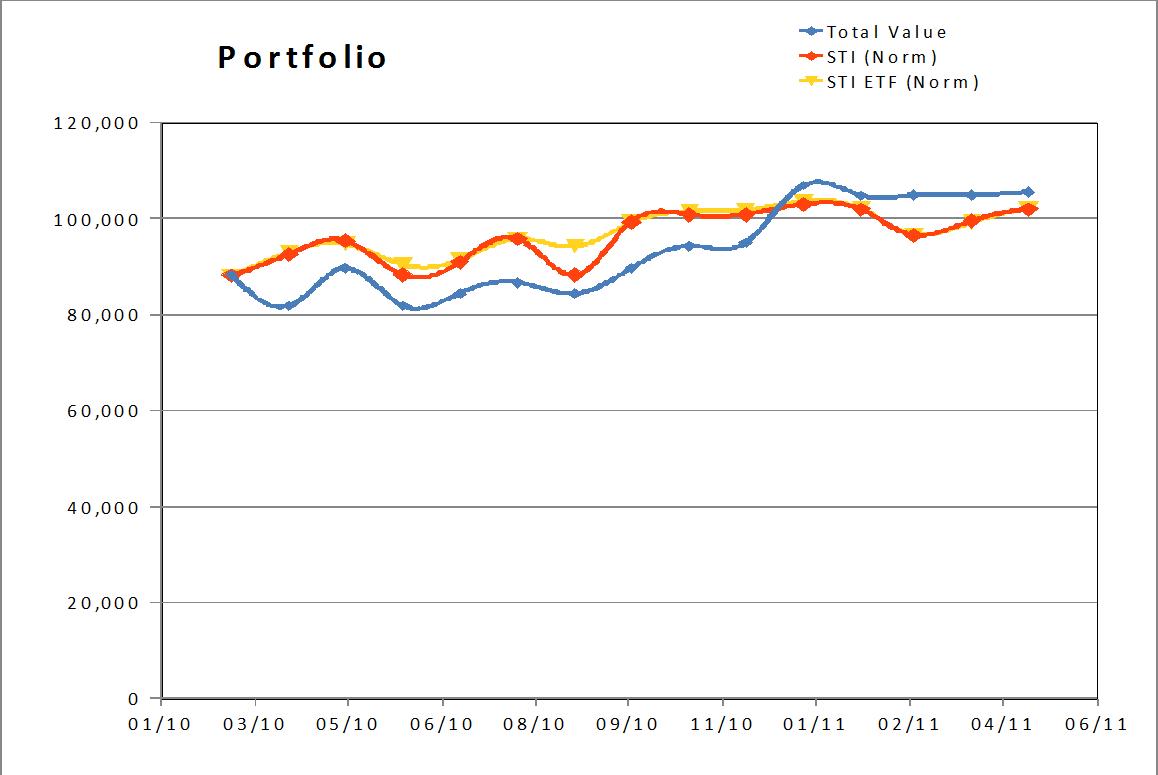
Here is a summary of my portfolio performance against the ST Index. Over the last 3 months, the STI has grown about 5% but my portfolio has only gone up by 0.7%. This is significantly lower.
The reason for the poor performance was due to the selling done in March 2011. This was done after observing the selling rules of seeing 3 black consecutive candles. Unfortunately, after selling the stocks move aggressively up. Resulting is difference of about about $3,965 of lost opportunities. Which translates into about 3.8%. Looking at this year's performance alone, I am lagging by about 0.3%. Due to the wrong moves in March and April. See table below for details.
| Month Ended | Total Value | Equity Value | Cash Value | Vested | Chg | Port Perf | STI val | STI Perf |
| 31/12/2010 | 107,021.21 | 98,120.00 | 8,901.21 | 91.7% | 12.6% | 21.3% | 3212 | 16.8% |
| 31/01/2011 | 104,898.73 | 78,760.00 | 26,138.73 | 75.1% | -2.0% | 18.9% | 3180 | 15.6% |
| 28/02/2011 | 104,988.58 | 18,350.00 | 86,638.58 | 17.5% | 0.1% | 19.0% | 3011 | 9.5% |
| 31/03/2011 | 104,999.09 | 67,770.00 | 37,229.09 | 64.5% | 0.0% | 19.0% | 3106 | 12.9% |
| 30/04/2011 | 105,604.51 | 24,650.00 | 80,954.51 | 23.3% | 0.6% | 19.7% | 3179 | 15.6% |
Looking at the cause behind the lag in performance, I will have to review my selling strategy. I need to consider some additional factors before deciding to sell.
| Trades Since 01-01-2011 | Qty. | Buy | Sell | Gain/Loss | Fees | NetProfit | Tot Profit | % ROI | Bought | Sold |
| Wilmar | 4000 | 5.2500 | 5.360 | 440.00 | 148.72 | 291.28 | 291.28 | 1.39% | 18/03/2011 | 06/04/2011 |
| StraitsAsia | 5000 | 2.4400 | 2.590 | 750.00 | 88.13 | 661.87 | 661.87 | 5.43% | 17/03/2011 | 15/04/2011 |
| HL Asia | 5000 | 2.8400 | 2.820 | -100.00 | 99.17 | -199.17 | -199.17 | -1.40% | 01/04/2011 | 15/04/2011 |
| SinoGrandness | 20000 | 0.4700 | 0.555 | 1,700.00 | 71.84 | 1,628.16 | 1,628.16 | 17.32% | 07/03/2011 | 18/04/2011 |
| Rotary | 5000 | 0.9600 | 0.990 | 150.00 | 58.46 | 91.54 | 91.54 | 1.91% | 01/04/2011 | 18/04/2011 |
| Rotary | 5000 | 0.9600 | 0.985 | 125.00 | 58.44 | 66.56 | 66.56 | 1.39% | 01/04/2011 | 18/04/2011 |
Net Realized profit for April 2011: $2,540.24. Very bad compared to the losses in March 2011.
Well, it is quite demoralizing to see your stock shoot up immediately after you sell. This is frustrating but, I think given the market condition, I can't really fault my decision. We can't see the future. We can only base our decision on what we see in the present and past. It is certainly very inaccurate to use past information to make decision on the future. Unfortunately, this is how it can be done. No way out. Now that I am only 76% vested, I can't really expect good performance unless the market is going to drop by a few %? That was I was expecting actually.
So, I need to seriously improve my trend reading skill even more.
 April 2011 was a bull run for SGX with index continuously moving upwards almost without any pause for more than 2 weeks. The move started in mid March and ended in Mid April gaining almost 10% within a month. This is the strongest since year 2011. It nearly recoup all the losses for the year. Last week's trading was almost all negative. Will this be a signal of the end of bull or a small pause to re-adjust itself?