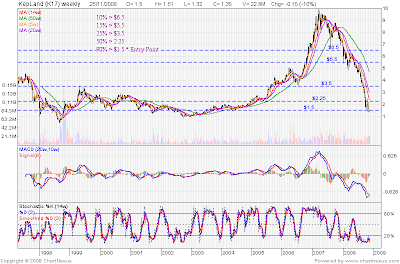
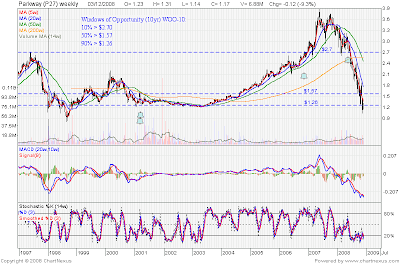
Why am I making such comparisons? The fact is that I had been trying to catch the bottom during this down trend. But, I'd found it too difficult and each time I tried, I would get burnt. So, to overcome that, I come up with this scheme. I started by looking at each stock's historical prices and using time horizon to measure the prices. This allows me to measure how much "time opportunity" that I have to trade (buy or sell) certain stock at certain prices assuming historical price is a good reflection of the future events.
I would buy the stock if it goes below the 90% time line mark. Not 90% chance or 90% of the price. I am not using price or probability (if there is a way?), I am using time line. If you are getting stock which is 90% low for a good company, I believe you will gain holding that stock and it would be a good price to enter.
DBS Bank:
Based on the 10 Year price charts, the following observations were made:
About 90% over the last 10 years, the prices of the stock has stayed above S$9.50. Which means that you have opportunity to buy the share below S$9.50 only 10% of the time.
 My entry point for DBS is below $9.50 and holding for long term (> 3 years). Even it the share goes to the 1998 lows, I believe it would stay there for a short period of time only. Since I am not a day trader, it is unlikely that I would be in front of the screen to catch it.
Note: Bought DBS @ $9.08.
Capitaland:
I only have information up to 2001. Based on these 7 year data, I concluded that a reasonable "buyable" price should be below S$2.40 and good and very safe entry point should be below S$1.50 (see below).
 Even though the prices has corrected quite a lot, its lack of historical background is making it look more expensive that it should. So, anything below $2.00 could be a good entry point. However, if you were to stick to the principle of margin of safety, then, below $1.50 is certainly the way to go.
Bought Capitaland @$2.56. Support seems strong.
CityDev:
This stock presents much better entry situation than Capitaland in terms of Property Sector. It is near the entry level of S$5.00 now. Historically, 90% of the last 10 year's prices are above S$5.00. Rallying to $7.00 should be no problem.
Keppel Corporation:
I had been monitoring this counter quite closely. Adjusted for the split, good entry price should be about S$3.00. With the uncertainty in the current market, it is entirely possible for it to go below S$3.00. But anything below S$4.00 would make good investing opportunity for this counter with its strong dividends.

I had been monitoring this counter quite closely. Adjusted for the split, good entry price should be about S$3.00. With the uncertainty in the current market, it is entirely possible for it to go below S$3.00. But anything below S$4.00 would make good investing opportunity for this counter with its strong dividends.

Keppel Land:
This is a stock that I had not been monitoring so closely. However, based on the recent performance, it tracked quite closely with CapitaLand. This counter reacts more severely to the current sub-prime crisis that Capitaland. I believe it was due to its nature of investment and it is heavily in the residential sector which is perceived to be under severe duress. The current price of S$1.37 is 10% below the S$1.50. This counter presents a good entry opportunity. We need to look at is balance sheet and profit and loss statement and the nature of properties it is holding to be double sure of the risk involved.

Cosco:
This is one time the darling of investors having pushed the price from around $1.35 to $8.0 within a period of 15 months from July 2006 to October 2008. An amazing counter int he SGX. This is the big brother of all S-Shares (China companies listed in SGX) in terms of market capitalization. Even though the prices has been badly battered down to the tune of over 90%, the Windows of Opportunity is not as clear as the counters presented above due to it short history and the fly-by-night nature. The lack of transparency is also another concern.

Parkway Healthcare Group:
Parkway is now below the 90% WOO level.

NOL:
The ChartNexus chart for NOL is skewed due to adjustments to dividends which as not done correctly. Similarly for all the other charts, the programming was not done properly when comes to adjustment to dividend. I think they just adjust according to the amount of dividend given instead of taking a ratio. That resulted in negative prices for past records. Anyway, NOL is now below 90% WOO based on 6 year chart. No 10 year data available.
 Current prices of $1.20 presents a good entry point for long term.
Note: Bought NOL at $1.04.
