Monday, March 21, 2011
STI - Market had a good run up today
Today, the market had a good steady run taking up the first level resistance easily and closed above it comfortably. However, the volume seemed to be muted. Not very strong buying interest seen. The next few trading sessions will give us clearer picture of how the market will eventually move. Let's see if this is indeed the turning point for the market or just a pause.
Sunday, March 20, 2011
High Probability of Market Down Trend 2011 Mar
I'd decided to take a closer look at the STI to see if there is anything that is useful from there.
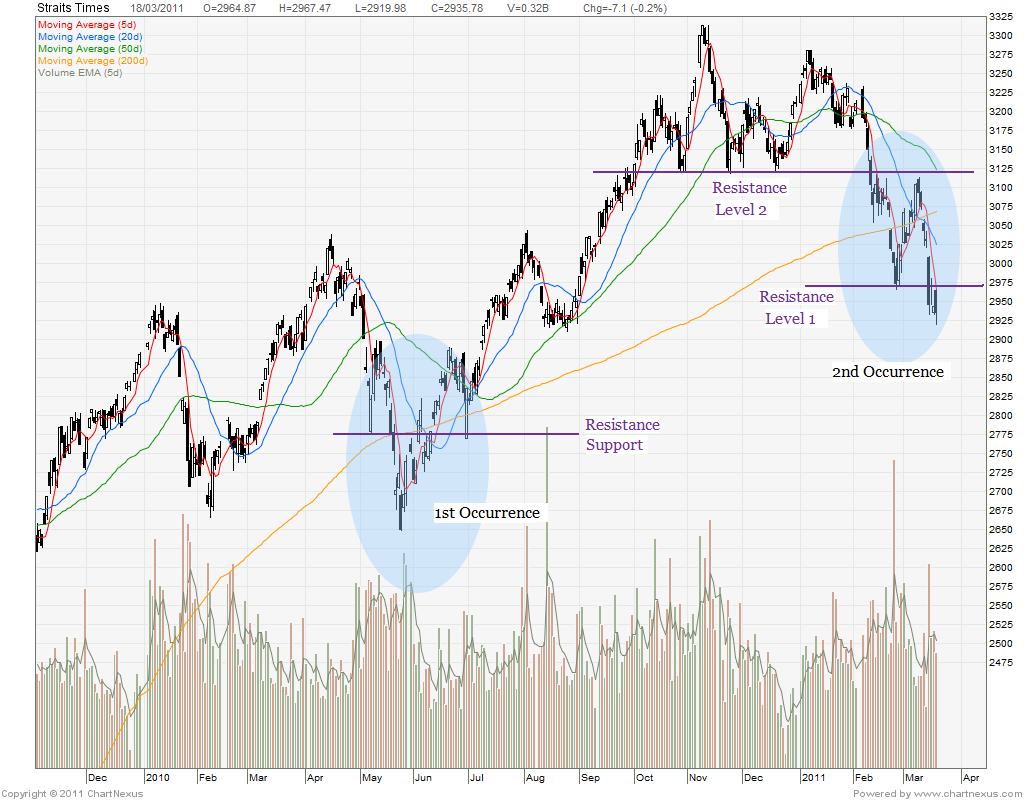
Over the last 12 months, there has been 2 occasions where the STI is trying to move below the 200SMA. The first occurrence was in June 2010. This was quickly taken back with a strong rally of about 750 points until Nov 2010. The second occurrence was in Feb 2011. The recovery was not successful and resulted in recent sell down in Mar 2011 assisted by the natural disaster in Japan.
On the shorter term, since year 2011, the market has been embarking on a correction path.
Using Elliott Wave (I am not an expert on EW), we can say that it is Wave ABC, the correction path. That means, the next move will be reset to wave count 1 (EW1), which means resuming the upward climb. In that case, the magnitude of the climb could be around the size of previous pattern or around 750 (2650-3300) - a major move as seen from Jun 2010 to Nov 2010.
However, basing on the chart pattern, there is also a possibility of further down trend since the 3-month trend is down. Using trend line method, there are 3 important points to take note. One, the chart is making lower low and lower high in last 3 months. Two, it failed to break out from the resistance Level 2 during the last counter trend rally. Typically, a failed move will result in bigger move in the opposite direction. Three, it has recently broken the support Level 1 (now become resistance Level 1) with the help of Japanese Nuclear crisis and Tsunami. Of course, one can argue that event 3 cannot be counted since it is extraordinary event. The sell down is due to knee-jerk reaction. Market will quickly recover from there. If this is true, then, we will wait for next week to see if the market really recover and overcome resistance Level 1 easily and convincingly. If that happens, I think we can be convinced that this is Wave C and we will be having Wave Count 1 coming up.
In essence, next week will be a critical week to observe the direction. This will give us a clearer picture whether the recent sell down was due to knee-jerk reaction or the Japanese disaster was just and "excuse". If the latter is true, it means that the sell down will happen regardless of the Japanese disaster. To verify that, we need to see if the STI can clear the Level 1 resistance easily.
Key fundamental factors in STI:
1. IPO of GLP & HPH Trust - mopped up large portion of liquidity (-)
2. Economic still growing strong (+)
3. Valuation become less attractive to foreign funds - funds pull out (-)
4. Inflation fears (-)
5. China internal consumption increase (+)
There are positive as well as negative factors.
Looking back at the 2008 market crash, we may learn something from there.
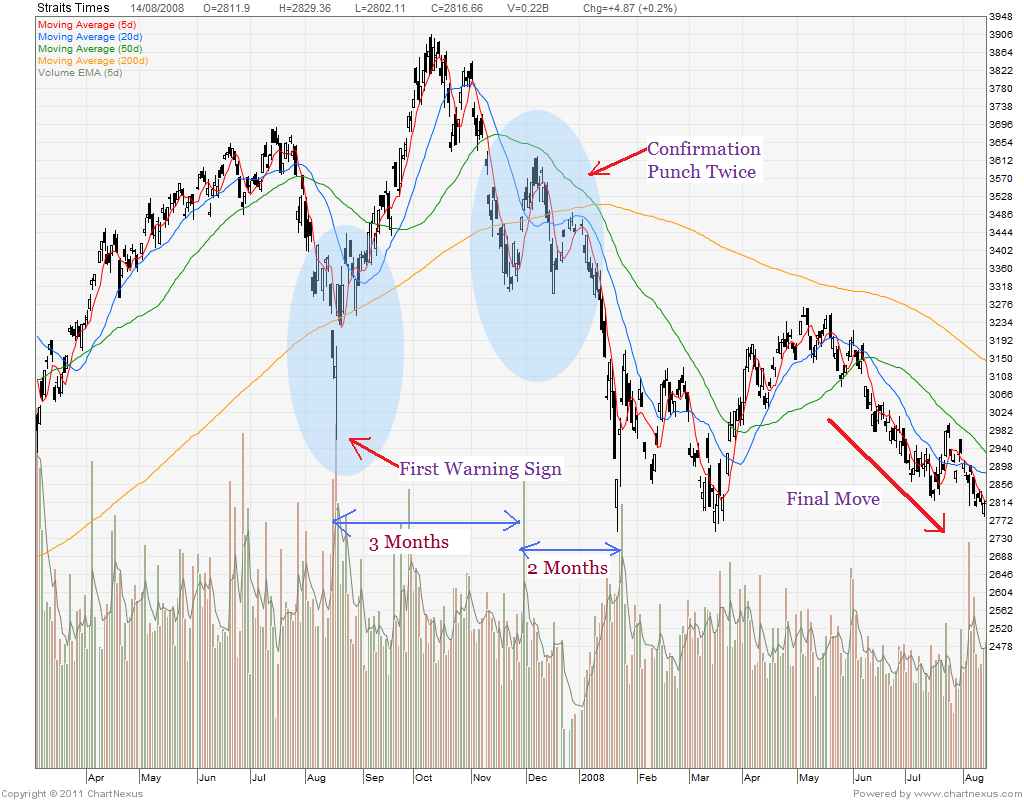
Based on the 2007 pattern, the first warning sign happens between mid July to mid August 2007 where the market drop over 20% within one month. This was followed by very strong recovery over the next 3-4 months. Then, there is second major drop which saw similar pattern of over 20% decline within a month. Again, there is strong recovery which is short live this time. It lasted less than a month and it gave way again. Then next bounce we can call it dead cat bounce that lasted for just over a week. Then the down trend is confirm and there is no doubt about it anymore. To say that the 2008 crash came suddenly is not exactly accurate. It did give some signals along the way. We can only say that we did not notice those signals until after the fact. Given such a back drop, we may want to approach the next few weeks trading with more care and closer attention.
Saturday, March 19, 2011
Stock Trading at 25-50% of its 2007 peak
Here is a list of stocks that are trading at between 25% to 50% of their 2007 peak prices (see below). I had not really gone through each of them. Some of them could had been suspended or de-listed (by right these should not exist). It will take some time to evaluate their worth.
| Security Name | HHV | LLV | CLOSE | Ratio% | Ticker Symbol |
| A-SONIC AEROSPACE LIMITED | 0.221 | 0.019 | 0.065 | 30.52 | A53 |
| ABTERRA LTD | 3.750 | 0.375 | 1.240 | 35.43 | L5I |
| ACE ACHIEVE INFOCOM LIMITED | 0.240 | 0.015 | 0.060 | 26.67 | A75 |
| ADDVALUE TECHNOLOGIES LTD | 0.175 | 0.030 | 0.040 | 25.81 | A31 |
| ADV INTEGRATED MFG CORP LTD | 0.435 | 0.035 | 0.115 | 28.40 | A54 |
| ADVANCED HOLDINGS LTD. | 0.645 | 0.090 | 0.215 | 35.25 | 5IA |
| ALLGREEN PROPERTIES LTD | 2.280 | 0.250 | 1.060 | 49.77 | A16 |
| ALLIED TECHNOLOGIES LIMITED | 0.147 | 0.018 | 0.065 | 48.87 | A13 |
| AMARA HOLDINGS LTD | 0.890 | 0.145 | 0.420 | 48.84 | A34 |
| AP OIL INTERNATIONAL LIMITED | 0.420 | 0.070 | 0.160 | 40.00 | 5AU |
| ASIA POWER CORP LTD | 0.415 | 0.110 | 0.145 | 37.66 | A03 |
| ASIAMEDIC LIMITED | 0.150 | 0.030 | 0.045 | 33.33 | 505 |
| ASIASONS WFG FINANCIAL LTD. | 0.390 | 0.095 | 0.140 | 38.36 | 5EC |
| ASIATIC GROUP (HOLDINGS) LTD | 0.250 | 0.035 | 0.075 | 34.09 | 5CR |
| ASIATRAVEL.COM HOLDINGS LTD | 0.900 | 0.200 | 0.365 | 43.71 | 5AM |
| ASJ HOLDINGS LTD | 0.220 | 0.016 | 0.045 | 25.14 | 538 |
| ASL MARINE HOLDINGS LTD | 1.362 | 0.250 | 0.595 | 45.80 | A04 |
| ASTI HOLDINGS LIMITED | 0.320 | 0.045 | 0.090 | 29.51 | 575 |
| AURIC PACIFIC GROUP LIMITED | 1.660 | 0.440 | 0.635 | 39.20 | A23 |
| AVJENNINGS LIMITED | 1.366 | 0.200 | 0.505 | 37.52 | A05 |
| AZEUS SYSTEMS HOLDINGS LTD. | 0.210 | 0.040 | 0.075 | 37.50 | A69 |
| AZTECH GROUP LTD. | 0.642 | 0.069 | 0.175 | 28.00 | 560 |
| BAN LEONG TECHNOLOGIES LIMITED | 0.345 | 0.100 | 0.130 | 41.27 | B26 |
| BANYAN TREE HOLDINGS LIMITED | 2.900 | 0.265 | 0.795 | 27.89 | B58 |
| BBR HOLDINGS (S) LTD | 0.950 | 0.150 | 0.240 | 26.67 | KJ5 |
| BERGER INTERNATIONAL LIMITED | 0.315 | 0.040 | 0.120 | 47.06 | B64 |
| BEST WORLD INTERNATIONAL LTD | 1.112 | 0.144 | 0.255 | 25.58 | 5ER |
| BEYONICSTECHNOLOGY LIMITED | 0.615 | 0.085 | 0.170 | 28.81 | B19 |
| BH GLOBAL MARINE LIMITED | 0.630 | 0.140 | 0.250 | 43.10 | B32 |
| BRC ASIA LIMITED | 0.310 | 0.075 | 0.135 | 45.76 | B03 |
| BROTHERS (HOLDINGS) LIMITED | 0.410 | 0.050 | 0.160 | 41.56 | G03 |
| BUKIT SEMBAWANG ESTATES LTD | 13.246 | 2.230 | 4.130 | 31.64 | B61 |
| CAMBRIDGE INDUSTRIAL TRUST | 0.985 | 0.175 | 0.475 | 48.97 | J91U |
| CAPITALAND LIMITED | 7.132 | 1.700 | 3.140 | 44.79 | C31 |
| CAPITAMALL TRUST | 3.526 | 0.935 | 1.710 | 49.41 | C38U |
| CAPITARETAIL CHINA TRUST | 3.340 | 0.405 | 1.220 | 38.61 | AU8U |
| CDW HOLDING LIMITED | 0.205 | 0.030 | 0.070 | 37.84 | D38 |
| CH OFFSHORE LTD | 1.060 | 0.220 | 0.430 | 44.47 | C13 |
| CHEMICAL INDUSTRIES (F.E.) LTD | 1.382 | 0.350 | 0.420 | 31.72 | C05 |
| CHEMOIL ENERGY LIMITED | 0.965 | 0.100 | 0.315 | 34.24 | AV5 |
| CHINA AVIATION OIL(S) CORP LTD | 3.190 | 0.480 | 1.250 | 42.00 | G92 |
| CHINA FARM EQUIPMENT LIMITED | 0.880 | 0.055 | 0.250 | 29.24 | A8J |
| CHINA FASHION HOLDINGS LIMITED | 0.210 | 0.020 | 0.070 | 33.33 | 5FK |
| CHINA HEALTHCARE LIMITED | 0.412 | 0.100 | 0.165 | 45.33 | 592 |
| CHINA INTERNATIONAL HLDGS LTD | 0.145 | 0.030 | 0.060 | 46.15 | C37 |
| CHINA PAPER HOLDINGS LIMITED | 0.345 | 0.090 | 0.120 | 37.50 | C71 |
| CHIP ENG SENG CORPORATION LTD | 1.078 | 0.125 | 0.450 | 45.05 | C29 |
| CHUAN HUP HOLDINGS LIMITED | 0.460 | 0.135 | 0.215 | 48.31 | C33 |
| CITY DEVELOPMENTS LTD NCCPS | 2.700 | 0.835 | 1.150 | 42.59 | C70 |
| CITYSPRING INFRASTRUCT TRUST | 1.219 | 0.381 | 0.525 | 43.35 | A7RU |
| CNA GROUP LTD. | 0.670 | 0.095 | 0.180 | 28.35 | 5GC |
| COUGAR LOGISTICS CORPN LTD | 0.609 | 0.110 | 0.260 | 44.75 | F86 |
| COURAGE MARINE GROUP LIMITED | 0.525 | 0.105 | 0.175 | 35.35 | E91 |
| CREATIVE MASTER BERMUDA LTD | 0.295 | 0.030 | 0.120 | 46.15 | C35 |
| CREATIVE TECHNOLOGY LTD | 9.950 | 2.380 | 3.430 | 35.18 | C76 |
| CSC HOLDINGS LTD | 0.484 | 0.065 | 0.130 | 29.21 | C06 |
| ECOWISE HOLDINGS LIMITED | 0.325 | 0.038 | 0.085 | 28.81 | 5CT |
| EZRA HOLDINGS LIMITED | 3.606 | 0.307 | 1.680 | 49.66 | 5DN |
| F J BENJAMIN HOLDINGS LTD | 0.786 | 0.100 | 0.350 | 45.99 | F10 |
| FABCHEM CHINA LIMITED | 0.575 | 0.100 | 0.220 | 39.64 | I54 |
| FALCON ENERGY GROUP LIMITED | 0.982 | 0.203 | 0.315 | 33.76 | 5FL |
| FDS NETWORKS GROUP LTD | 0.150 | 0.010 | 0.040 | 27.97 | F07 |
| FISCHER TECH LTD | 0.385 | 0.035 | 0.110 | 29.33 | F22 |
| FOOD EMPIRE HOLDINGS LIMITED | 0.992 | 0.200 | 0.480 | 49.66 | F03 |
| FOOD JUNCTION HOLDINGS LIMITED | 0.685 | 0.115 | 0.205 | 30.15 | 529 |
| FREIGHT LINKS EXPRESS HOLDINGS | 0.165 | 0.030 | 0.060 | 38.71 | F01 |
| FRIVEN & CO. LTD. | 0.440 | 0.080 | 0.120 | 30.00 | 5RF |
| FU YU CORPORATION LTD | 0.395 | 0.040 | 0.095 | 25.68 | F13 |
| FUJI OFFSET PLATES MFG LTD | 0.830 | 0.160 | 0.270 | 33.54 | 508 |
| G. K. GOH HOLDINGS LIMITED | 1.550 | 0.405 | 0.635 | 42.62 | G41 |
| GALLANT VENTURE LTD. | 1.450 | 0.060 | 0.365 | 26.64 | 5IG |
| GIKEN SAKATA (S) LIMITED | 0.170 | 0.020 | 0.050 | 30.30 | 542 |
| GLOBAL TECH (HLDGS) LIMITED | 0.050 | 0.005 | 0.010 | 28.57 | G11 |
| GRAND BANKS YACHTS LIMITED | 1.090 | 0.260 | 0.360 | 34.62 | G50 |
| GUL TECHNOLOGIES SINGAPORE LTD | 0.185 | 0.020 | 0.085 | 50.00 | G09 |
| GUOCOLAND LIMITED | 5.564 | 0.860 | 2.350 | 42.95 | F17 |
| GUOCOLEISURE LIMITED | 1.800 | 0.215 | 0.750 | 45.45 | B16 |
| HARTAWAN HLDGS LTD | 0.319 | 0.030 | 0.080 | 27.97 | 5FU |
| HEETON HOLDINGS LIMITED | 1.170 | 0.150 | 0.450 | 40.54 | 5DP |
| HG METAL MANUFACTURING LTD | 0.416 | 0.075 | 0.110 | 28.06 | 526 |
| HIAP HOE LIMITED | 0.970 | 0.048 | 0.400 | 42.55 | 5JK |
| HIAP SENG ENGINEERING LTD | 1.203 | 0.120 | 0.470 | 41.05 | 510 |
| HLH GROUP LIMITED | 0.089 | 0.008 | 0.025 | 30.86 | H27 |
| HLN TECHNOLOGIES LIMITED | 1.000 | 0.100 | 0.280 | 29.47 | 5HH |
| HONG FOK CORPORATION LTD | 1.774 | 0.150 | 0.505 | 29.67 | H30 |
| HONGWEI TECHNOLOGIES LIMITED | 0.470 | 0.085 | 0.185 | 41.11 | H80 |
| HOSEN GROUP LTD | 0.350 | 0.045 | 0.115 | 35.38 | 5EV |
| HOTEL PROPERTIES LTD | 6.111 | 0.800 | 2.270 | 38.57 | H15 |
| HSR GLOBAL LIMITED | 0.660 | 0.230 | 0.270 | 40.91 | 502 |
| HUAN HSIN HOLDINGS LTD | 0.725 | 0.190 | 0.215 | 30.07 | H16 |
| HUPSTEEL LTD | 0.535 | 0.100 | 0.220 | 43.19 | H73 |
| INFORMATICS EDUCATION LTD. | 0.225 | 0.015 | 0.100 | 47.62 | I03 |
| INTERNATIONAL PRESS SOFTCOM | 0.205 | 0.035 | 0.055 | 28.21 | 571 |
| INTERRA RESOURCES LIMITED | 0.395 | 0.055 | 0.130 | 35.14 | 5GI |
| INTRACO LIMITED | 0.665 | 0.130 | 0.280 | 44.44 | I06 |
| ISDN HOLDINGS LIMITED | 0.515 | 0.080 | 0.140 | 27.67 | I07 |
| ITE ELECTRIC CO LTD | 0.240 | 0.020 | 0.060 | 31.58 | 581 |
| JACKS INTERNATIONAL LIMITED | 0.170 | 0.050 | 0.080 | 48.48 | J11 |
| JACKSPEED CORPORATION LIMITED | 0.305 | 0.060 | 0.105 | 36.21 | J17 |
| JADASON ENTERPRISES LTD | 0.265 | 0.030 | 0.090 | 36.73 | J03 |
| JAYA HOLDINGS LTD | 2.050 | 0.185 | 0.520 | 25.87 | J10 |
| JUNMA TYRE CORD COMPANY LTD | 0.355 | 0.030 | 0.140 | 43.08 | 5FJ |
| K-REIT ASIA | 2.815 | 0.430 | 1.250 | 46.31 | K71U |
| KINERGY LTD. | 0.320 | 0.020 | 0.150 | 49.18 | 5JT |
| KOH BROTHERS GROUP LIMITED | 0.645 | 0.075 | 0.190 | 30.40 | K75 |
| KSH HOLDINGS LIMITED | 0.668 | 0.078 | 0.220 | 35.77 | ER0 |
| KYODO-ALLIED INDUSTRIES LTD | 0.255 | 0.015 | 0.080 | 32.00 | 5BL |
| LAFE CORPORATION LIMITED | 0.211 | 0.029 | 0.060 | 29.13 | L05 |
| LANTROVISION (S) LTD | 0.106 | 0.015 | 0.030 | 31.25 | 5BH |
| LASSETERS INTL HOLDINGS LTD | 0.473 | 0.064 | 0.180 | 39.30 | 5EL |
| LHT HOLDINGS LIMITED | 0.215 | 0.035 | 0.080 | 39.02 | L10 |
| LIAN BENG GROUP LTD | 0.820 | 0.090 | 0.280 | 35.67 | L03 |
| LINAIR TECHNOLOGIES LIMITED | 0.201 | 0.022 | 0.050 | 27.03 | 5FW |
| LIZHONG WHEEL GROUP LTD. | 1.280 | 0.110 | 0.425 | 34.84 | E94 |
| LMA INTERNATIONAL N.V. | 0.715 | 0.100 | 0.310 | 44.60 | L24 |
| LONGCHEER HOLDINGS LIMITED | 0.855 | 0.210 | 0.255 | 31.48 | L28 |
| LORENZO INTERNATIONAL LIMITED | 0.477 | 0.055 | 0.140 | 32.26 | 5IE |
| MACQUARIE INT'L INFRA FUND LTD | 1.230 | 0.235 | 0.575 | 47.92 | M41 |
| MATEX INTERNATIONAL LIMITED | 0.280 | 0.055 | 0.090 | 32.14 | M15 |
| MEDI-FLEX LIMITED | 0.310 | 0.030 | 0.135 | 48.21 | 5FF |
| MEGHMANI ORGANICS LIMITED | 0.560 | 0.060 | 0.185 | 40.66 | M30 |
| MEIBAN GROUP LTD | 0.657 | 0.086 | 0.300 | 48.00 | M24 |
| METAL COMPONENT ENGG LTD | 0.205 | 0.020 | 0.055 | 29.73 | 5DX |
| METAX ENGINEERING CORP LIMITED | 0.300 | 0.070 | 0.070 | 26.42 | 5HV |
| MFG INTEGRATION TECHNOLOGY LTD | 0.305 | 0.035 | 0.115 | 41.82 | M11 |
| MIDAS HLDGS LIMITED | 2.340 | 0.250 | 0.680 | 29.69 | 5EN |
| MIYOSHI PRECISION LIMITED | 0.315 | 0.055 | 0.095 | 34.55 | M03 |
| NATURAL COOL HOLDINGS LIMITED | 0.411 | 0.130 | 0.185 | 48.78 | 5IF |
| NEPTUNE ORIENT LINES LIMITED | 5.780 | 0.768 | 1.950 | 35.11 | N03 |
| NH CERAMICS LTD | 0.235 | 0.020 | 0.065 | 27.66 | 5AC |
| NIPPECRAFT LIMITED | 0.185 | 0.030 | 0.050 | 28.57 | N32 |
| NTEGRATOR INTERNATIONAL LTD | 0.059 | 0.014 | 0.020 | 33.90 | 5HC |
| OAKWELL ENGINEERING LIMITED | 0.190 | 0.020 | 0.065 | 39.39 | 584 |
| OCEAN SKY INTERNATIONAL LTD | 0.330 | 0.030 | 0.125 | 42.37 | O05 |
| OCEANUS GROUP LIMITED | 0.470 | 0.060 | 0.205 | 45.05 | 579 |
| PACIFIC ANDES RESOURCES DEVLTD | 0.720 | 0.082 | 0.325 | 46.43 | P11 |
| PACIFIC CENTURY REGIONAL DEVTS | 0.420 | 0.130 | 0.185 | 44.58 | P15 |
| PAN HONG PROPERTY GROUP LTD | 1.020 | 0.080 | 0.410 | 42.27 | P36 |
| PAN-UNITED CORPORATION LTD | 1.072 | 0.315 | 0.490 | 46.58 | P52 |
| PENGUIN INTERNATIONAL LIMITED | 0.336 | 0.040 | 0.080 | 25.08 | P13 |
| PEOPLE'S FOOD HOLDINGS LIMITED | 2.290 | 0.320 | 0.780 | 35.94 | P05 |
| PLATO CAPITAL LIMITED | 0.668 | 0.101 | 0.160 | 26.36 | 5PI |
| PNE INDUSTRIES LTD | 0.165 | 0.020 | 0.075 | 46.88 | P07 |
| POLLUX PROPERTIES LTD. | 0.240 | 0.030 | 0.070 | 33.33 | 5AE |
| POPULAR HOLDINGS LIMITED | 0.328 | 0.079 | 0.155 | 49.84 | P29 |
| PROGEN HOLDINGS LTD | 0.190 | 0.020 | 0.065 | 35.14 | 583 |
| PSC CORPORATION LTD | 0.686 | 0.130 | 0.260 | 40.44 | DM0 |
| RADIANCE GROUP LIMITED | 0.260 | 0.050 | 0.090 | 37.50 | 5DC |
| RENEWABLE ENERGY ASIA GRP LTD | 0.515 | 0.035 | 0.185 | 39.36 | 5DW |
| ROWSLEY LTD. | 0.336 | 0.023 | 0.090 | 32.73 | A50 |
| SAKAE HOLDINGS LTD. | 0.445 | 0.090 | 0.190 | 44.71 | 5DO |
| SAMUDERA SHIPPING LINE LTD | 0.520 | 0.120 | 0.200 | 39.22 | S56 |
| SANTAK HOLDINGS LIMITED | 0.370 | 0.080 | 0.130 | 41.94 | 580 |
| SAPPHIRE CORPORATION LIMITED | 0.760 | 0.100 | 0.305 | 46.21 | NF1 |
| SC GLOBAL DEVELOPMENTS LTD | 3.405 | 0.295 | 1.340 | 40.53 | D2S |
| SCINTRONIX CORPORATION LTD. | 0.180 | 0.035 | 0.075 | 44.12 | T20 |
| SCORPIO EAST HOLDINGS LTD. | 0.295 | 0.075 | 0.120 | 44.44 | 5HW |
| SHANGHAI TURBO ENTERPRISES LTD | 0.230 | 0.030 | 0.085 | 41.46 | X27 |
| SILVERLAKE AXIS LTD | 0.956 | 0.079 | 0.300 | 32.57 | 5CP |
| SINGAPORE EXCHANGE LIMITED | 17.200 | 4.000 | 7.320 | 46.04 | S68 |
| SINGAPORE SHIPPING CORP LTD | 0.485 | 0.120 | 0.220 | 47.83 | S19 |
| SINGXPRESS LAND LTD. | 0.125 | 0.010 | 0.030 | 27.27 | 5CE |
| SINOBEST TECHNOLOGY HLDGS LTD. | 0.270 | 0.035 | 0.110 | 44.90 | T80 |
| SINOMEM TECHNOLOGY LIMITED | 1.640 | 0.050 | 0.680 | 43.31 | S14 |
| SINOPIPE HOLDINGS LIMITED | 0.600 | 0.045 | 0.225 | 39.47 | X06 |
| SINWA LIMITED | 0.715 | 0.050 | 0.210 | 32.01 | 5CN |
| SKY CHINA PETROLEUM SVCS LTD. | 0.680 | 0.055 | 0.185 | 30.33 | W81 |
| SMB UNITED LIMITED | 0.506 | 0.100 | 0.215 | 45.45 | S16 |
| STAMFORD TYRES CORPORATIONLTD | 0.629 | 0.155 | 0.275 | 45.53 | S29 |
| STATS CHIPPAC LTD | 1.404 | 0.202 | 0.675 | 48.84 | S24 |
| STRATECH SYSTEMS LIMITED | 0.110 | 0.010 | 0.030 | 31.58 | S73 |
| STX PAN OCEAN CO., LTD. | 42.400 | 6.000 | 10.680 | 26.57 | GZ9 |
| SUNLIGHT GROUP HLDG LTD | 0.160 | 0.010 | 0.040 | 27.59 | 5AI |
| SUNNINGDALE TECH LTD | 0.485 | 0.030 | 0.145 | 30.53 | T35 |
| SUNRIGHT LTD | 0.530 | 0.075 | 0.185 | 35.92 | S71 |
| SUPERBOWL HOLDINGS LIMITED | 0.520 | 0.085 | 0.245 | 49.00 | S48 |
| SWISSCO HOLDINGS LIMITED | 0.880 | 0.060 | 0.230 | 28.22 | 5FD |
| TAI SIN ELECTRIC LIMITED | 0.595 | 0.110 | 0.200 | 35.09 | 500 |
| TEXCHEM-PACK HOLDINGS (S) LTD. | 0.335 | 0.060 | 0.085 | 25.37 | AI1 |
| THAKRAL CORPORATION LTD | 0.073 | 0.009 | 0.030 | 44.12 | T04 |
| TIONG WOON CORP HOLDING LTD | 1.260 | 0.135 | 0.315 | 26.03 | T06 |
| TMC EDUCATION CORPORATION LTD | 0.332 | 0.040 | 0.085 | 29.62 | 586 |
| TOP GLOBAL LIMITED | 0.054 | 0.003 | 0.015 | 34.88 | 519 |
| TRANSVIEW HOLDINGS LIMITED | 0.412 | 0.045 | 0.135 | 34.79 | T19 |
| TSH CORPORATION LIMITED | 0.338 | 0.052 | 0.150 | 46.15 | 574 |
| UNION STEEL HOLDINGS LIMITED | 0.442 | 0.060 | 0.115 | 27.12 | V69 |
| UNITED FOOD HOLDINGS LIMITED | 0.245 | 0.030 | 0.070 | 30.43 | U01 |
| UPP HOLDINGS LIMITED | 0.339 | 0.051 | 0.130 | 41.01 | U09 |
| VICPLAS INTERNATIONAL LTD | 0.285 | 0.035 | 0.090 | 35.29 | 569 |
| WING TAI HLDGS LTD | 3.562 | 0.518 | 1.410 | 40.74 | W05 |
| YANLORD LAND GROUP LIMITED | 4.400 | 0.495 | 1.390 | 33.90 | Z25 |
| YING LI INTL REAL ESTATE LTD | 1.230 | 0.055 | 0.370 | 31.90 | 5DM |
| YONGNAM HOLDINGS LIMITED | 0.539 | 0.050 | 0.255 | 49.51 | Y02 |
Stocks Trading at 25% of its 2007 peak or lower
Out of curiosity, I had mad a scan on a list of stocks trading at 25% or lower of its 2007 peak. I wonder if there is any good value stocks in there. Some of these could have been a goner. Some could had been suspended. Some are so inactive and low market cap that they may not worth a look. Over the next couple of weeks, I will have to spend time digging out each of the counters and see if there is any that is worth putting money in.
| Security Name | HHV | LLV | CLOSE | Ratio% | Ticker Symbol |
| AA GROUP HOLDINGS LTD. | 0.300 | 0.040 | 0.045 | 20.93 | 5GZ |
| ADROIT INNOVATIONS LIMITED | 0.150 | 0.010 | 0.020 | 14.81 | A33 |
| ADVANCE SCT LIMITED | 1.220 | 0.025 | 0.045 | 3.87 | 5FH |
| ADVANCED SYSTEMS AUTOMATION | 0.165 | 0.005 | 0.005 | 3.57 | 520 |
| ADVENTUS HOLDINGS LIMITED | 0.370 | 0.020 | 0.030 | 9.38 | 5EF |
| AEM HOLDINGS LTD | 0.260 | 0.010 | 0.035 | 14.29 | A10 |
| ALBEDO LIMITED | 0.225 | 0.035 | 0.040 | 19.05 | 5IB |
| AMPLEFIELD LIMITED | 0.100 | 0.010 | 0.015 | 18.75 | C60 |
| ANNAIK LIMITED | 0.525 | 0.075 | 0.100 | 20.62 | A52 |
| ANNICA HOLDINGS LIMITED | 0.455 | 0.025 | 0.030 | 7.23 | 5AL |
| ANWELL TECHNOLOGIES LIMITED | 1.867 | 0.140 | 0.340 | 20.82 | G5X |
| ARMARDA GROUP LIMITED | 0.445 | 0.015 | 0.080 | 20.51 | 5EK |
| ASIA ENVIRONMENT HOLDINGS LTD | 0.944 | 0.055 | 0.215 | 23.37 | A58 |
| ASIA SILK HOLDINGS LIMITED | 0.155 | 0.020 | 0.030 | 21.43 | 5GP |
| ASIA WATER TECHNOLOGY LTD. | 0.354 | 0.021 | 0.065 | 19.12 | 5GB |
| ASIAN MICRO HOLDINGS LTD | 0.165 | 0.010 | 0.010 | 6.45 | 585 |
| AUSGROUP LIMITED | 2.180 | 0.100 | 0.325 | 15.55 | 5GJ |
| AUSSINO GROUP LTD | 0.460 | 0.075 | 0.090 | 20.69 | A15 |
| AUSTRALAND PROPERTYGROUP | 12.500 | 0.975 | 2.900 | 23.20 | K2X |
| AUTRON CORPORATION LIMITED | 0.140 | 0.005 | 0.020 | 16.00 | A19 |
| BIO-TREAT TECHNOLOGY LIMITED | 0.809 | 0.020 | 0.040 | 5.41 | B22 |
| BRIGHT ORIENT (HOLDING) LTD. | 0.235 | 0.015 | 0.050 | 22.22 | 5DT |
| BRITISH & MALAYAN TRUSTEES LTD | 50.000 | 5.550 | 5.550 | 11.56 | B08 |
| C&G ENV PROTECT HLDGS LTD | 0.765 | 0.045 | 0.165 | 23.57 | D79 |
| CARRIERNET GLOBAL LTD | 0.115 | 0.005 | 0.010 | 10.00 | 5BI |
| CELESTIAL NUTRIFOODS LIMITED | 1.770 | 0.080 | 0.170 | 10.24 | C56 |
| CENTILLION ENV & RECYC LIMITED | 0.220 | 0.005 | 0.005 | 2.44 | C49 |
| CHASEN HOLDINGS LIMITED | 1.768 | 0.071 | 0.330 | 23.34 | 5NV |
| CHINA AUTO CORPORATION LTD. | 0.175 | 0.010 | 0.035 | 23.33 | A01 |
| CHINA AUTO ELECTRONICS GRP LTD | 0.830 | 0.030 | 0.115 | 15.03 | T42 |
| CHINA BEARING (SINGAPORE) LTD. | 0.485 | 0.040 | 0.050 | 10.53 | AD7 |
| CHINA DAIRY GROUP LTD | 0.555 | 0.045 | 0.085 | 15.89 | T16 |
| CHINA ENERGY LIMITED | 1.930 | 0.075 | 0.100 | 5.41 | A0G |
| CHINA ENVIRONMENT LTD. | 0.765 | 0.060 | 0.180 | 24.83 | 5OU |
| CHINA ENVIRONMENTAL RES GP LTD | 0.200 | 0.025 | 0.030 | 17.14 | M8J |
| CHINA ESSENCE GROUP LTD. | 1.210 | 0.090 | 0.260 | 23.01 | G54 |
| CHINA FLEXIBLE PACK HLDG LTD | 0.580 | 0.100 | 0.120 | 21.43 | C59 |
| CHINA GREAT LAND HOLDINGS LTD. | 0.260 | 0.015 | 0.030 | 12.50 | D50 |
| CHINA HAIDA LTD. | 0.390 | 0.040 | 0.040 | 10.39 | C92 |
| CHINA HONGXING SPORTS LIMITED | 1.450 | 0.055 | 0.115 | 8.39 | BR9 |
| CHINA KANGDA FOOD COMPANY LTD | 0.590 | 0.085 | 0.085 | 15.89 | P74 |
| CHINA MILK PRODUCTS GROUP LTD | 1.630 | 0.200 | 0.240 | 15.48 | G86 |
| CHINA POWERPLUS LIMITED | 0.445 | 0.030 | 0.045 | 10.47 | Z02 |
| CHINA SKY CHEM FIBRE CO., LTD. | 2.740 | 0.120 | 0.155 | 6.13 | E90 |
| CHINA SUN BIOCHEM TECH GP CO. | 0.765 | 0.045 | 0.055 | 7.43 | C86 |
| CHINA TITANIUM LTD. | 0.439 | 0.005 | 0.010 | 2.79 | 530 |
| CHINA YONGSHENG LIMITED | 2.050 | 0.005 | 0.015 | 0.73 | 5KK |
| CHINASING INVESTMENT HLDG LTD | 0.077 | 0.005 | 0.005 | 7.25 | C16 |
| CHINAVISION MEDIA GRP LIMITED | 4.050 | 0.320 | 0.800 | 20.00 | S91 |
| CHINESE GLOBAL INVESTORS GRP | 0.450 | 0.020 | 0.045 | 10.84 | 5CJ |
| CHT (HOLDINGS) LTD. | 0.710 | 0.025 | 0.110 | 15.71 | C36 |
| COMMUNICATION DESIGN INTL LTD | 0.455 | 0.045 | 0.045 | 10.23 | 5HT |
| COMPACT METAL INDUSTRIES LTD | 0.046 | 0.005 | 0.005 | 11.90 | C02 |
| CONTEL CORPORATION LIMITED | 0.290 | 0.005 | 0.030 | 11.54 | F75 |
| COSCO CORPORATION (S) LTD | 7.961 | 0.587 | 1.810 | 23.90 | F83 |
| CPH LTD | 0.080 | 0.005 | 0.010 | 15.87 | 539 |
| CRAFT PRINT INTERNATIONAL LTD | 0.137 | 0.025 | 0.025 | 19.61 | 541 |
| DARCO WATER TECHNOLOGIES LTD | 0.435 | 0.035 | 0.065 | 16.05 | 5CB |
| DELONG HOLDINGS LIMITED | 4.020 | 0.345 | 0.420 | 10.82 | B1N |
| DEVOTION ENERGY GROUP LIMITED | 0.510 | 0.035 | 0.070 | 14.29 | D08 |
| DIGILAND INTERNATIONAL LTD | 0.070 | 0.005 | 0.005 | 8.33 | G77 |
| DRAGON GROUP INTL LIMITED | 0.516 | 0.055 | 0.055 | 10.83 | MT1 |
| E3 HOLDINGS LTD. | 0.155 | 0.005 | 0.005 | 4.00 | 5AJ |
| EASTGATE TECHNOLOGY LTD | 0.058 | 0.002 | 0.005 | 9.26 | E05 |
| ELLIPSIZ LTD | 0.941 | 0.023 | 0.115 | 12.67 | E13 |
| EMS ENERGY LIMITED | 0.283 | 0.020 | 0.040 | 15.38 | 5DE |
| ENVIRO-HUB HOLDINGS LTD | 0.528 | 0.051 | 0.120 | 23.72 | L23 |
| EQUATION CORP LIMITED | 0.304 | 0.015 | 0.040 | 15.94 | 532 |
| ESMART HOLDINGS LIMITED | 5.000 | 0.200 | 0.320 | 8.65 | 5SO |
| EUCON HOLDING LIMITED | 0.200 | 0.010 | 0.030 | 16.22 | E27 |
| EUNETWORKS GROUP LIMITED | 0.192 | 0.008 | 0.015 | 8.57 | H23 |
| EUROPTRONIC GROUP LTD | 0.146 | 0.016 | 0.025 | 18.10 | E23 |
| EXCELPOINT TECHNOLOGY LTD | 0.270 | 0.020 | 0.055 | 21.57 | E17 |
| FASTUBE LIMITED | 0.530 | 0.045 | 0.065 | 13.54 | 5IH |
| FEDERAL INT(2000) LTD | 0.585 | 0.038 | 0.055 | 10.04 | F20 |
| FIBRECHEM TECHNOLOGIES LIMITED | 1.900 | 0.100 | 0.105 | 5.90 | F12 |
| FIRST SHIP LEASE TRUST | 1.686 | 0.320 | 0.400 | 24.57 | D8DU |
| FIRSTLINK INV CORP LTD | 0.179 | 0.010 | 0.010 | 5.92 | S82 |
| FRASERS COMMERCIAL TRUST | 3.625 | 0.360 | 0.750 | 22.06 | ND8U |
| FUNG CHOI MEDIA GROUP LIMITED | 0.770 | 0.045 | 0.165 | 22.76 | F11 |
| GEMS TV HOLDINGS LIMITED | 1.800 | 0.005 | 0.030 | 1.71 | AM3 |
| GLOBAL INVESTMENTS LIMITED | 1.161 | 0.041 | 0.145 | 12.79 | B73 |
| GLOBAL TESTING CORPORATION LTD | 0.360 | 0.035 | 0.070 | 20.59 | G31 |
| GLOBAL YELLOW PAGES LIMITED | 0.679 | 0.061 | 0.155 | 23.13 | Y07 |
| GOLDTRON LIMITED | 0.030 | 0.005 | 0.005 | 18.52 | 536 |
| GUANGZHAO IND FOREST BIOGRPLTD | 0.465 | 0.030 | 0.060 | 14.63 | G21 |
| HL GLOBAL ENTERPRISES LIMITED | 0.590 | 0.025 | 0.070 | 12.84 | L18 |
| HOR KEW CORPORATION LIMITED | 0.340 | 0.030 | 0.060 | 20.76 | H06 |
| HUP SOON GLOBAL CORP LTD | 1.800 | 0.040 | 0.145 | 8.53 | 5JY |
| INFINIO GROUP LIMITED | 0.430 | 0.005 | 0.010 | 2.60 | 5CS |
| INNO-PACIFIC HOLDINGS LTD | 0.082 | 0.010 | 0.010 | 14.71 | I26 |
| INNOVALUES LIMITED | 0.900 | 0.035 | 0.100 | 12.27 | 591 |
| INTERNET TECHNOLOGY GRP LTD | 0.140 | 0.015 | 0.030 | 25.00 | I14 |
| IPCO INT'L LIMITED | 0.135 | 0.015 | 0.015 | 13.64 | I11 |
| JAPAN LAND LIMITED | 1.900 | 0.125 | 0.265 | 15.14 | C7B |
| JASPER INVESTMENTS LIMITED | 0.875 | 0.055 | 0.060 | 8.00 | FQ7 |
| JEL CORPORATION (HOLDINGS) LTD | 0.316 | 0.005 | 0.030 | 10.27 | J16 |
| JEP HOLDINGS LTD. | 0.584 | 0.017 | 0.035 | 7.90 | 5FA |
| JETS TECHNICS INTL HLDGS LTD | 0.125 | 0.005 | 0.010 | 9.09 | J19 |
| JIUTIAN CHEMICAL GROUP LIMITED | 0.820 | 0.025 | 0.065 | 8.67 | C8R |
| KEPPEL TELE & TRAN | 5.900 | 0.680 | 1.270 | 22.05 | K11 |
| KLW HOLDINGS LTD | 0.200 | 0.005 | 0.010 | 5.41 | 504 |
| KODA LTD | 1.030 | 0.085 | 0.125 | 12.76 | 5BK |
| KOYO INTERNATIONAL LIMITED | 0.680 | 0.040 | 0.050 | 8.33 | 5OC |
| KS ENERGY SERVICES LIMITED | 4.295 | 0.460 | 0.900 | 21.64 | 578 |
| KXD DIGITAL ENTERTAINMENT LTD | 0.200 | 0.005 | 0.010 | 5.41 | K07 |
| L.C.DEVELOPMENT LTD | 0.590 | 0.064 | 0.125 | 22.98 | L38 |
| LANKOM ELECTRONICS LIMITED | 0.380 | 0.025 | 0.030 | 9.09 | L22 |
| LERENO BIO-CHEM LTD. | 0.168 | 0.003 | 0.005 | 3.33 | 587 |
| LIANG HUAT ALUMINIUM LTD | 0.520 | 0.009 | 0.015 | 3.46 | C4P |
| LIFEBRANDZ LTD. | 0.083 | 0.005 | 0.010 | 13.33 | L20 |
| LINDETEVES-JACOBERG LTD | 0.170 | 0.010 | 0.030 | 18.75 | L15 |
| LOTTVISION LIMITED | 0.725 | 0.025 | 0.030 | 4.48 | M22 |
| LUXKING GROUP HOLDINGS LIMITED | 0.215 | 0.020 | 0.020 | 10.00 | L34 |
| LUZHOU BIO-CHEM TECHNOLOGY LTD | 0.750 | 0.050 | 0.085 | 11.56 | L46 |
| M DEVELOPMENT LTD. | 0.145 | 0.010 | 0.030 | 24.00 | N14 |
| MACARTHURCOOK PROP SEC FUND | 1.424 | 0.060 | 0.125 | 8.78 | A0P |
| MAGNUS ENERGY GROUP LTD. | 0.210 | 0.015 | 0.020 | 10.00 | 576 |
| MDR LIMITED | 0.115 | 0.005 | 0.005 | 5.26 | A27 |
| MEMSTAR TECHNOLOGY LTD. | 0.350 | 0.015 | 0.050 | 20.00 | 5MS |
| MFS TECHNOLOGY LTD | 1.060 | 0.100 | 0.150 | 14.29 | 5BM |
| MIRACH ENERGY LIMITED | 0.541 | 0.015 | 0.095 | 18.30 | C68 |
| MOYA DAYEN LIMITED | 0.644 | 0.023 | 0.060 | 9.79 | 5BT |
| NEL GROUP LTD. | 0.225 | 0.015 | 0.040 | 19.05 | 597 |
| NET PACIFIC FIN HLDGS LTD | 0.280 | 0.030 | 0.040 | 14.29 | 5QY |
| NEW LAKESIDE HOLDINGS LIMITED | 0.170 | 0.015 | 0.020 | 13.33 | 5EG |
| NEW WAVE HOLDINGS LTD. | 0.074 | 0.005 | 0.010 | 16.67 | 5FX |
| NEXT-GEN SATELLITE COMM LTD | 0.254 | 0.005 | 0.040 | 19.23 | B07 |
| NICO STEEL HOLDINGS LIMITED | 0.400 | 0.035 | 0.090 | 22.96 | 5GF |
| OCEAN INT'L HOLDINGS LIMITED | 0.125 | 0.005 | 0.010 | 8.70 | O30 |
| OMEGA NAVIGATION ENT,INC. | 36.000 | 1.410 | 1.410 | 3.92 | O57 |
| ONIONTECH LIMITED | 0.190 | 0.020 | 0.035 | 18.92 | 5HG |
| ORIENTAL CENTURY LIMITED | 1.430 | 0.135 | 0.155 | 12.20 | 5II |
| OUHUA ENERGY HOLDINGS LIMITED | 0.755 | 0.040 | 0.070 | 9.72 | AJ2 |
| PACIFIC HEALTHCARE HLDGS LTD | 0.459 | 0.015 | 0.105 | 23.60 | P47 |
| PHARMESIS INTERNATIONAL LTD. | 0.240 | 0.025 | 0.045 | 20.45 | P31 |
| PLASTOFORM HOLDINGS LIMITED | 0.240 | 0.010 | 0.015 | 6.82 | P82 |
| PT BERLIAN LAJU TANKER TBK | 0.323 | 0.033 | 0.050 | 17.06 | B66 |
| PTERIS GLOBAL LIMITED | 1.191 | 0.083 | 0.160 | 14.05 | J74 |
| RAFFLES EDUCATION CORP LIMITED | 1.700 | 0.235 | 0.255 | 15.45 | E6D |
| ROTOL SINGAPORE LIMITED | 0.215 | 0.020 | 0.020 | 9.76 | R10 |
| SEE HUP SENG LIMITED | 0.948 | 0.113 | 0.180 | 19.87 | 566 |
| SELECT GROUP LIMITED | 0.880 | 0.100 | 0.125 | 15.15 | 5FQ |
| SEROJA INVESTMENTS LIMITED | 2.000 | 0.245 | 0.265 | 13.25 | IW5 |
| SING HOLDINGS LIMITED | 1.282 | 0.100 | 0.305 | 24.92 | 5IC |
| SINO TECHFIBRE LIMITED | 1.770 | 0.055 | 0.090 | 5.33 | AD8 |
| SINO-ENVIRONMENT TECH GRP LTD | 4.020 | 0.055 | 0.135 | 3.67 | Y62 |
| SITRA HOLDINGS (INTL) LIMITED | 0.535 | 0.050 | 0.060 | 12.50 | 5LE |
| SKY ONE HOLDINGS LIMITED | 0.580 | 0.020 | 0.030 | 5.77 | 5MM |
| SM SUMMIT HOLDINGS LTD | 0.595 | 0.060 | 0.145 | 24.37 | S43 |
| SPICE I2I LIMITED | 0.373 | 0.036 | 0.060 | 17.19 | M09 |
| ST. JAMES HOLDINGS LIMITED | 0.381 | 0.070 | 0.075 | 22.66 | 5NH |
| STAR PHARMACEUTICAL LIMITED | 0.615 | 0.030 | 0.075 | 12.40 | X64 |
| SUN EAST GROUP LIMITED | 0.340 | 0.005 | 0.010 | 3.08 | Y35 |
| SUNMOON FOOD COMPANY LIMITED | 0.025 | 0.005 | 0.005 | 25.00 | F06 |
| SUNRAY HOLDINGS LIMITED | 0.260 | 0.010 | 0.020 | 8.33 | S38 |
| SUNSHINE HOLDINGS LIMITED | 0.550 | 0.005 | 0.050 | 9.62 | Y34 |
| SURFACE MOUNT TECH (HLDGS) LTD | 0.505 | 0.035 | 0.085 | 17.89 | S57 |
| SWIBER HOLDINGS LIMITED | 3.840 | 0.235 | 0.765 | 20.79 | AK3 |
| SWING MEDIA TECHNOLOGY GRP LTD | 0.174 | 0.033 | 0.040 | 25.00 | 5BQ |
| SYNEAR FOOD HOLDINGS LIMITED | 2.520 | 0.110 | 0.150 | 6.38 | Z75 |
| TAT HONG HOLDINGS LTD | 3.500 | 0.365 | 0.800 | 23.95 | T03 |
| TELEDATA (SINGAPORE) LTD | 0.100 | 0.005 | 0.015 | 18.75 | T28 |
| THE LEXICON GROUP LIMITED | 0.212 | 0.010 | 0.020 | 10.36 | 5KX |
| THE STYLE MERCHANTS LIMITED | 0.190 | 0.013 | 0.030 | 17.65 | N37 |
| TRANSCU GROUP LIMITED | 0.714 | 0.055 | 0.060 | 9.79 | E15 |
| TT INTERNATIONAL LIMITED | 0.354 | 0.015 | 0.040 | 12.05 | T09 |
| ULTRO TECHNOLOGIES LIMITED | 0.288 | 0.020 | 0.030 | 11.36 | U16 |
| UNIFIED COMMUNICATIONS HLDGLTD | 0.170 | 0.020 | 0.040 | 25.00 | U18 |
| UNIONMET (SINGAPORE) LIMITED | 0.468 | 0.017 | 0.060 | 13.51 | A6F |
| UNITED FIBER SYSTEM LIMITED | 0.345 | 0.015 | 0.045 | 13.85 | P30 |
| VALLIANZ HOLDINGS LIMITED | 0.386 | 0.026 | 0.050 | 14.04 | 545 |
| VAN DER HORST ENERGY LIMITED | 0.560 | 0.095 | 0.120 | 22.43 | 595 |
| VASHION GROUP LTD. | 0.095 | 0.005 | 0.010 | 13.33 | 5BA |
| VGO CORPORATION LIMITED | 0.160 | 0.010 | 0.035 | 25.00 | E09 |
| WESTECH ELECTRONICS LIMITED | 3.910 | 0.040 | 0.055 | 1.52 | 5RJ |
| XPRESS HOLDINGS LTD | 0.230 | 0.040 | 0.050 | 24.39 | I04 |
| YOMA STRATEGIC HOLDINGS LTD | 0.370 | 0.045 | 0.075 | 21.74 | Z59 |
| YOUCAN FOODS INTERNATIONAL LTD | 0.380 | 0.050 | 0.055 | 14.86 | Y06 |
| ZHONGHUI HOLDINGS LTD. | 0.450 | 0.010 | 0.010 | 2.33 | Z04 |
Market Performance After 2008 Crash
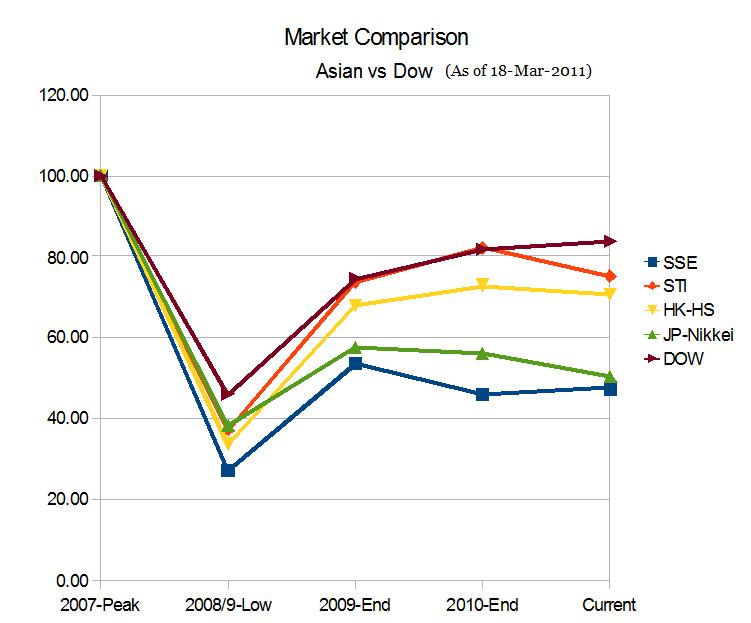
Just had a simple look into the market performance after the 2008 financial crisis triggered from US sub-prime mortgage problem. There are the comparisons between Asian markets with Dow Jones:
The values are expressed in percentage using the 2007 peak values as 100%.
Since the crisis initiated from US, one would expect the Dow to be most affected by the crisis. Instead it was SSE (Shanghai Stock Exchange) that was worst hit. In terms of recent recovery, there were so much talk about China leading the world market in the economic recovery from the crisis. Instead, Dow was the best performer and SSE was the worst performer among these markets.
 Plotting them on a simple graph for comparison. It can be seen that both SSE and Nikkei were the worst performers. However, we need to take into consideration of the recent drop in Nikkei due to natural disaster. Discounting that could have brought them back up by 10%. But still, they are the second worst performer in Asia.
The fact that SSE is not performing as expected is slightly worrying. One thing we can assume is that the SSE is extremely over priced in 2007 and now it is more reasonable priced. However, if the market in China is really good, why shouldn't it be over priced? Isn't the market suppose to chase after promising counters and ditch the unattractive counters? I thought market is always over bought on bullish sector and oversold on bearish sector. Maybe I am over paranoid. One other explanation is the QE by Fed really flooded the US market with liquidity causing the price to be overvalued. Another angle to look at it is the value of US dollar. How much has it depreciated against other currencies? Is SSE a victim of stronger currency? What about Nikkei and others?
Modified: 20-Mar-2011.
After the Nuclear crisis in Japan, the Yen shot up and the G7 work together to bring it down. A strong Yen will hurt Japanese economy more at a time when they desperately needed a weaker currency to build up their internal economy.
With a weaker Yen, there will be impact on the US economy and may cause bigger US trade deficit. The US has to again release more liquidity into the market by QE (3) and potentially will hurt China's export. So, what will China do in response? Will China take the reverse role with US by significantly increasing local consumption? How ready is China's economy to do that? How much real purchasing power do China have?
| Index | 2007-Peak | 2008/9-Low | 2009-End | 2010-End | Current |
| SSE | 100.00 | 27.21 | 53.55 | 45.88 | 47.48 |
| STI | 100.00 | 37.25 | 73.71 | 82.23 | 75.14 |
| HK-HS | 100.00 | 33.78 | 68.02 | 72.77 | 70.56 |
| JP-Nikkei | 100.00 | 38.22 | 57.63 | 55.90 | 50.31 |
| DOW | 100.00 | 46.00 | 74.46 | 81.67 | 83.71 |
The values are expressed in percentage using the 2007 peak values as 100%.
Since the crisis initiated from US, one would expect the Dow to be most affected by the crisis. Instead it was SSE (Shanghai Stock Exchange) that was worst hit. In terms of recent recovery, there were so much talk about China leading the world market in the economic recovery from the crisis. Instead, Dow was the best performer and SSE was the worst performer among these markets.
 Plotting them on a simple graph for comparison. It can be seen that both SSE and Nikkei were the worst performers. However, we need to take into consideration of the recent drop in Nikkei due to natural disaster. Discounting that could have brought them back up by 10%. But still, they are the second worst performer in Asia.
The fact that SSE is not performing as expected is slightly worrying. One thing we can assume is that the SSE is extremely over priced in 2007 and now it is more reasonable priced. However, if the market in China is really good, why shouldn't it be over priced? Isn't the market suppose to chase after promising counters and ditch the unattractive counters? I thought market is always over bought on bullish sector and oversold on bearish sector. Maybe I am over paranoid. One other explanation is the QE by Fed really flooded the US market with liquidity causing the price to be overvalued. Another angle to look at it is the value of US dollar. How much has it depreciated against other currencies? Is SSE a victim of stronger currency? What about Nikkei and others?
Modified: 20-Mar-2011.
After the Nuclear crisis in Japan, the Yen shot up and the G7 work together to bring it down. A strong Yen will hurt Japanese economy more at a time when they desperately needed a weaker currency to build up their internal economy.
With a weaker Yen, there will be impact on the US economy and may cause bigger US trade deficit. The US has to again release more liquidity into the market by QE (3) and potentially will hurt China's export. So, what will China do in response? Will China take the reverse role with US by significantly increasing local consumption? How ready is China's economy to do that? How much real purchasing power do China have?
Thursday, March 17, 2011
Is the market preparing for major descent?
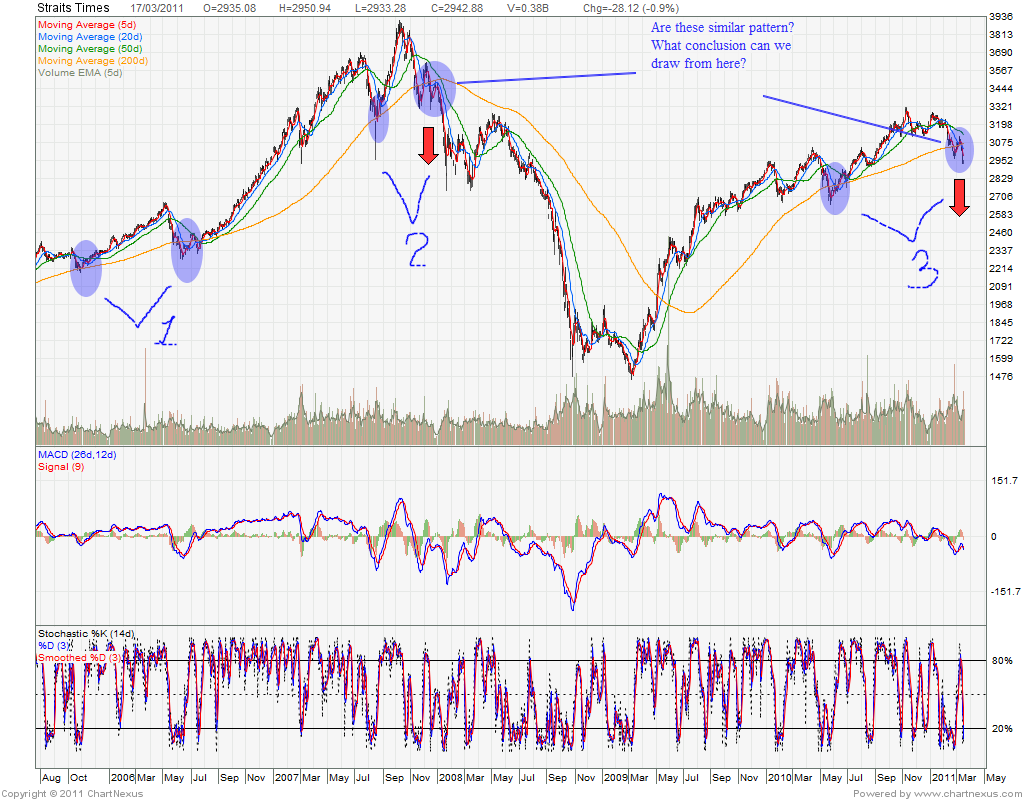 As I review through the index components of STI, I noticed that most of the counters had been experiencing corrections of about 20% over the last 3-4 months. Most of them are now trading below the 200-period moving average. Comparing this scenario with end of 2007, I am trying to figure out whether there is any sign of break down.
In 2007, the run up to the crash was a super bull run from 2004 and punctuated by 2006 correction and 2007 correction. The last leg was extremely strong followed by rapid correction then crashes.
There are 3 pairs of patterns where prices move below 200-period moving average during bull run. I call them pattern 1, 2 and 3 (see picture). Pattern 1 was a false warning. It resulted in super bull run in 2006/2007. Pattern 2 was the real warning. It resulted in 2008 crash. The million dollar question is whether this pattern is real warning?
A check on each of the component stocks reveals that majority of them (about 25/30) are trading below 200-period moving average now. Some of the started the down trend 6 months ago while other 3 months ago. For those stocks that are still sitting on top of the 200-period moving average, they are on the down trend also. How long this down trend will persist is anyone's guess. If the current situation persists, this may result in a slow grind to the bottom.
In essence, the major trend of the market has actually turn negative and has persisted for more than 3 months. The major macroeconomic factor seem to support such trend. If the macroeconomic factors persists for another 3 months, the trend should be confirm and we should expect further down side.
Sunday, March 6, 2011
Monthly Trading Standing
 Putting myself into the line by exposing my trade performance. Tracking performance is very importance if you are serious about trading and investing. If you lose picture of your real performance, you are not going to make serious money.
The key measurement is the index performance. I think I need to track the index as well.
Looking at the normalized STI index (month's closing value) against my portfolio, I realized that my performance is actually ahead of the STI index stocks. (I had previously posted a calculation that showed STI increase by 31% from Feb 2010 to Feb 2011)
Before I come up with this method of measurement, I had no idea of how I actually perform against the major index. When I saw my portfolio increase by 18% over the last one year, I thought I was doing all right. I felt quite satisfied with that number. When I told my friend about my performance, he thought that I was on the right track because he obviously did worse than I do. I was happy for a while. But I had no idea whether I really out perform the Index.
Then I decided to get serious and try to normalized the STI index using my initial portfolio value and make comparison neck-to-neck. I realized that I am on the right track.
| Month Ended | Total Value | Equity Value | Cash Value | Vested | Chg | Port Perf | ST Index |
| 28/02/2010 | 88,241.76 | 29,100.00 | 59,141.76 | 33.0% | 2750 | ||
| 31/03/2010 | 81,884.82 | 37,210.00 | 44,674.82 | 45.4% | -7.2% | -7.2% | 2887 |
| 30/04/2010 | 89,801.52 | 30,650.00 | 59,151.52 | 34.1% | 9.7% | 1.8% | 2975 |
| 31/05/2010 | 81,884.82 | 37,210.00 | 44,674.82 | 45.4% | -8.8% | -7.2% | 2753 |
| 30/06/2010 | 84,523.72 | 24,650.00 | 59,873.72 | 29.2% | 3.2% | -4.2% | 2836 |
| 31/07/2010 | 86,770.52 | 70,610.00 | 16,160.52 | 81.4% | 2.7% | -1.7% | 2988 |
| 31/08/2010 | 84,503.39 | 55,450.00 | 29,053.39 | 65.6% | -2.6% | -4.2% | 2753 |
| 30/09/2010 | 89,778.20 | 47,150.00 | 42,628.20 | 52.5% | 6.2% | 1.7% | 3098 |
| 31/10/2010 | 94,407.07 | 69,550.00 | 24,857.07 | 73.7% | 5.2% | 7.0% | 3143 |
| 30/11/2010 | 95,045.95 | 60,200.00 | 34,845.95 | 63.3% | 0.7% | 7.7% | 3145 |
| 31/12/2010 | 107,021.21 | 98,120.00 | 8,901.21 | 91.7% | 12.6% | 21.3% | 3212 |
| 31/01/2011 | 104,898.73 | 78,760.00 | 26,138.73 | 75.1% | -2.0% | 18.9% | 3180 |
| 28/02/2011 | 104,988.58 | 18,350.00 | 86,638.58 | 17.5% | 0.1% | 19.0% | 3011 |
| 31/03/2011 | 104,508.77 | 46,650.00 | 57858.77 | 44.6% | -0.5% | 18.4% | 3061 |
So, what's next?
The key now is to continue to out perform and improve on my performance if possible. Instead of 18% annual return, now, try to target 30% annualized return.
Saturday, March 5, 2011
Trading Rules
It is not easy to be discipline. I had fallen into the trap many times. The latest was Renewable Energy. I suffer a loss of 26% which is way above my usual cut loss point of 12%. Another counter was Mun Siong. Also suffer losses of 18%. I finally decided to sell them off and focus my effort on more promising counters. These were the highest losses I took for this year. My short term trade usually has a cut off point of a few ticks below the support or 3-4 consecutive black bars and down trend.
Even though I expected the price will recover soon, I still take losses. For example, CapitaMallAsia (CMA), I decided to sell away at 10% losses even though I thought it will re-bounce soon.
Even though I expected the price will recover soon, I still take losses. For example, CapitaMallAsia (CMA), I decided to sell away at 10% losses even though I thought it will re-bounce soon.
Wednesday, March 2, 2011
Stock Trading Results Feb 2011
Here is the results:
Most of the counters were sold during the correction. Some of the counters suffered more than expected losses due to procrastination. That means failure to follow my own rules. Overall, the result was below satisfaction particularly failing to cut losses according to the 10% rules.
TRADE CLOSED IN FEBRUARY 2011
NET PROFIT/LOSS = $-299.15
Moving forward, I hope to be more discipline and follow my own rules more strictly. On top of that, there is also a need to look into improving the trading rules. What are they? Where to modify? Not finalized yet.
TRADE CLOSED IN JANUARY 2011
TOTAL PROFIT/LOSS = $+7965.97
Most of the counters were sold during the correction. Some of the counters suffered more than expected losses due to procrastination. That means failure to follow my own rules. Overall, the result was below satisfaction particularly failing to cut losses according to the 10% rules.
TRADE CLOSED IN FEBRUARY 2011
| Trades Since 01-Feb-2011 | Qty. | Buy | Sell | Gain/Loss | Fees | Profit | Net Profit | % ROI | Bought | Sold |
| UniFood | 100000 | 0.0850 | 0.075 | -1,000.00 | 61.63 | -1,061.63 | -1,061.63 | -12.49% | 10/02/2011 | 15/02/2011 |
| SinoGrandness | 40000 | 0.4250 | 0.565 | 5,600.00 | 138.77 | 5,461.23 | 5,461.23 | 32.12% | 22/10/2010 | 15/02/2011 |
| STX PO | 1000 | 13.1600 | 12.000 | -1,160.00 | 88.17 | -1,248.17 | -1,248.17 | -9.48% | 09/12/2010 | 16/02/2011 |
| UETF SSE 50 | 5000 | 1.9500 | 2.000 | 250.00 | 69.21 | 180.79 | 180.79 | 1.85% | 01/02/2011 | 22/02/2011 |
| RenewableEne | 40000 | 0.2550 | 0.190 | -2,600.00 | 66.36 | -2,666.36 | -2,666.36 | -26.14% | 17/01/2011 | 22/02/2011 |
| CapitaMallAsia | 5000 | 1.9300 | 1.750 | -900.00 | 65.01 | -965.01 | -965.01 | -10.00% | 01/12/2010 | 23/02/2011 |
NET PROFIT/LOSS = $-299.15
Moving forward, I hope to be more discipline and follow my own rules more strictly. On top of that, there is also a need to look into improving the trading rules. What are they? Where to modify? Not finalized yet.
TRADE CLOSED IN JANUARY 2011
| Trades Since 01-01-2011 | Qty. | Buy | Sell | Gain/Loss | Fees | Profit | Net Profit | % ROI | Bought | Sold |
| Delong | 20000 | 0.5100 | 0.570 | 1,200.00 | 75.69 | 1,124.31 | 1,124.31 | 11.02% | 06/12/2010 | 04/01/2011 |
| UETF 50 SSE | 5000 | 2.0700 | 2.080 | 50.00 | 72.71 | -22.71 | -22.71 | -0.22% | 21/07/2010 | 13/01/2011 |
| China Sky Chem | 50000 | 0.2500 | 0.255 | 250.00 | 88.48 | 161.52 | 161.52 | 1.29% | 29/09/2009 | 13/01/2011 |
| ComfortDelgro | 5000 | 1.4700 | 1.630 | 800.00 | 61.38 | 738.62 | 738.62 | 10.05% | 03/11/2010 | 14/01/2011 |
| China Sky Chem | 50000 | 0.1850 | 0.250 | 3,250.00 | 76.22 | 3,173.78 | 3,173.78 | 34.31% | 01/12/2010 | 14/01/2011 |
| China Sky Chem | 50000 | 0.2000 | 0.240 | 2,000.00 | 77.09 | 1,922.91 | 1,922.91 | 19.23% | 06/12/2010 | 17/01/2011 |
| FalconEnergy | 40000 | 0.4600 | 0.485 | 1,000.00 | 132.46 | 867.54 | 867.54 | 4.71% | 10/12/2010 | 27/01/2011 |
TOTAL PROFIT/LOSS = $+7965.97
Subscribe to:
Posts (Atom)
About Me

- ES Sei
- I'd like to share my experiences and knowledge about healthy and happy living as well as mid-life crisis. 不以物喜,不以己悲。